Bid Recap / Summary
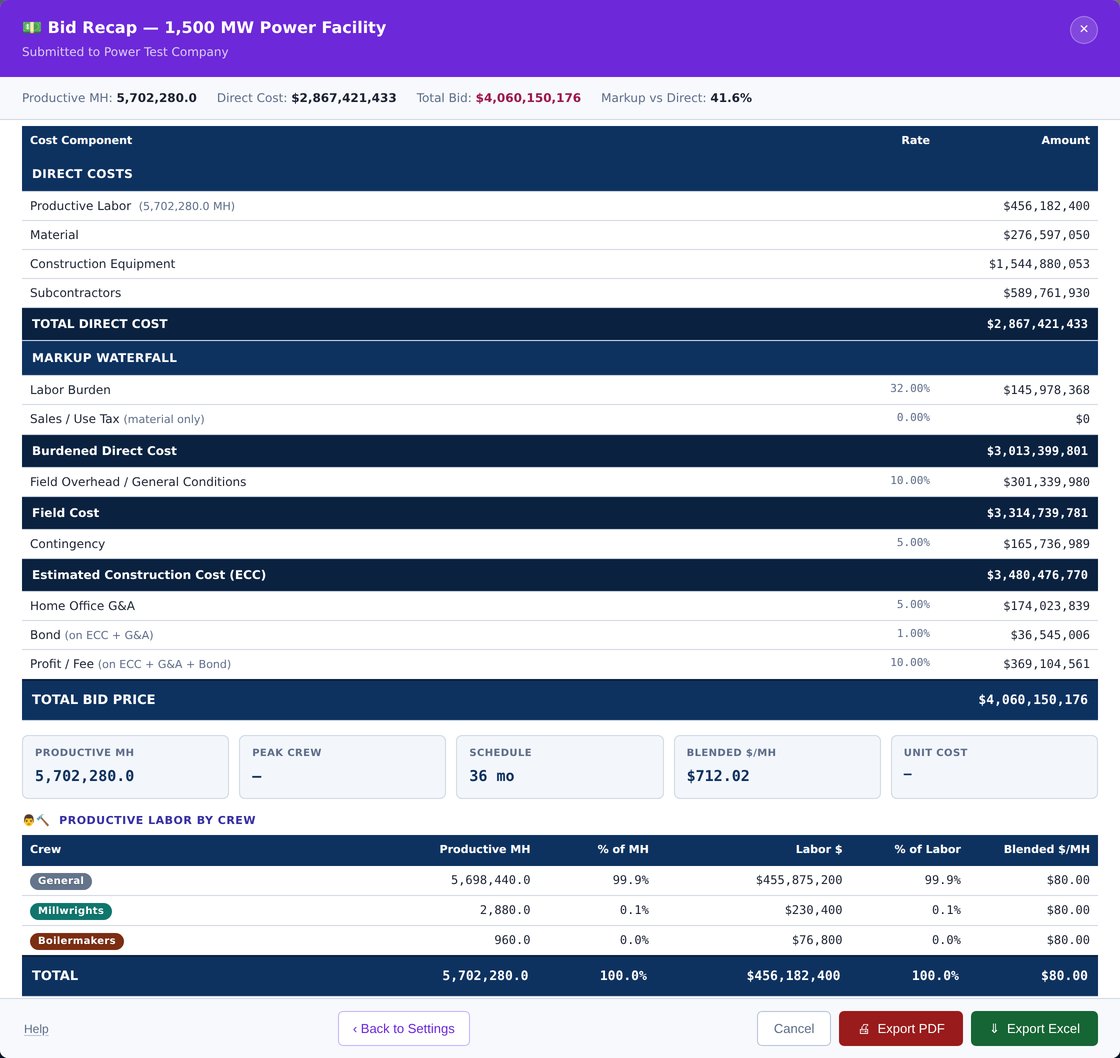
The one-page executive summary that goes to the owner. The full markup waterfall — labor burden, sales tax, field overhead, contingency, G&A, bond, and profit — each step computed live from your inputs, with KPI tiles and a productive-labor-by-crew breakdown underneath. Exports to Excel with formula chains intact so your reviewer can trace every number.
Cash Flow / Billing Schedule
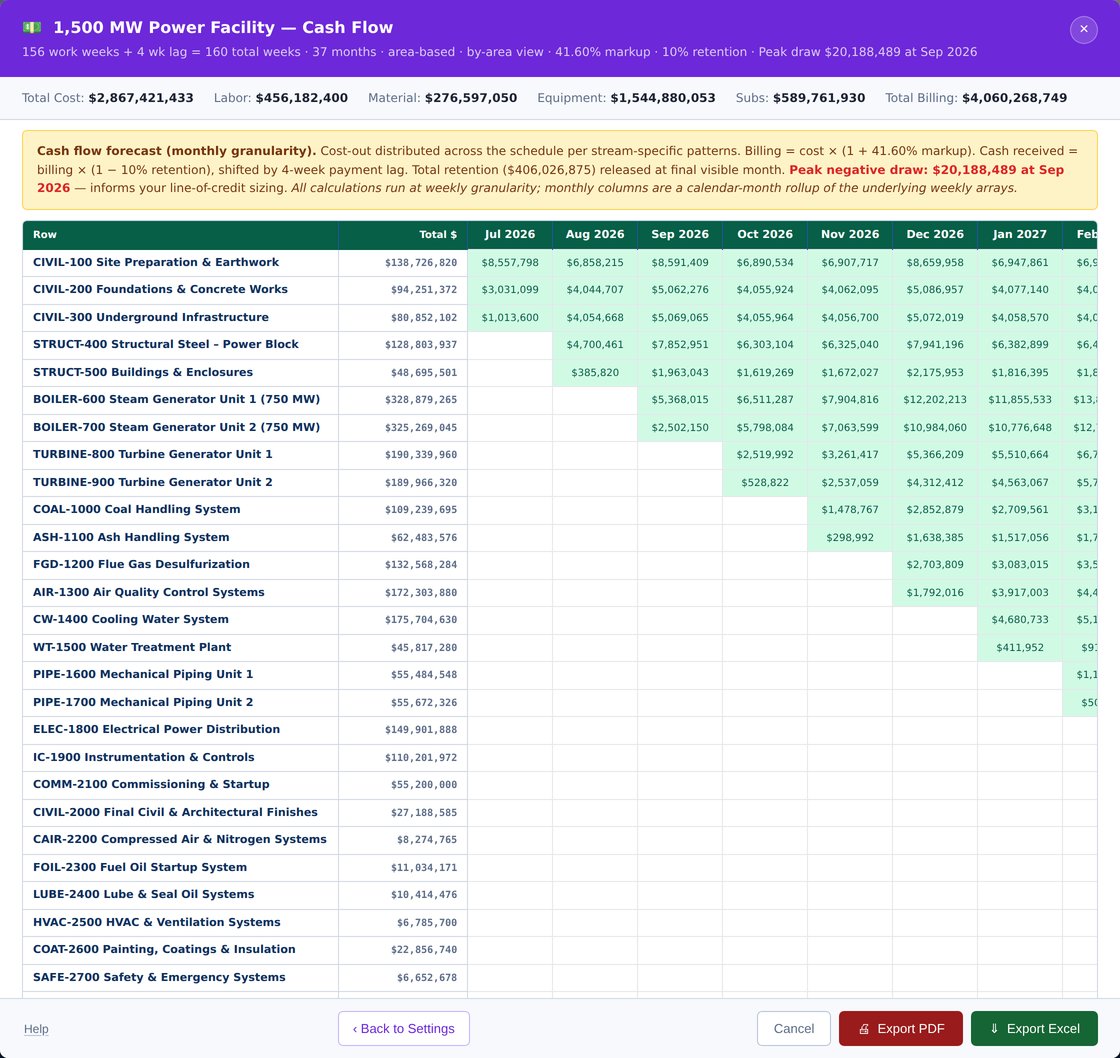
Month-by-month forecast of cost-out, billing, cash received, and net cash position — with retention held and the peak negative draw called out so you know exactly how much line of credit the job needs. Four cost streams each carry their own distribution timing, viewable by plant area or by stream. The Excel export includes a stacked bar + line combo chart.
Manpower-Loaded Schedule
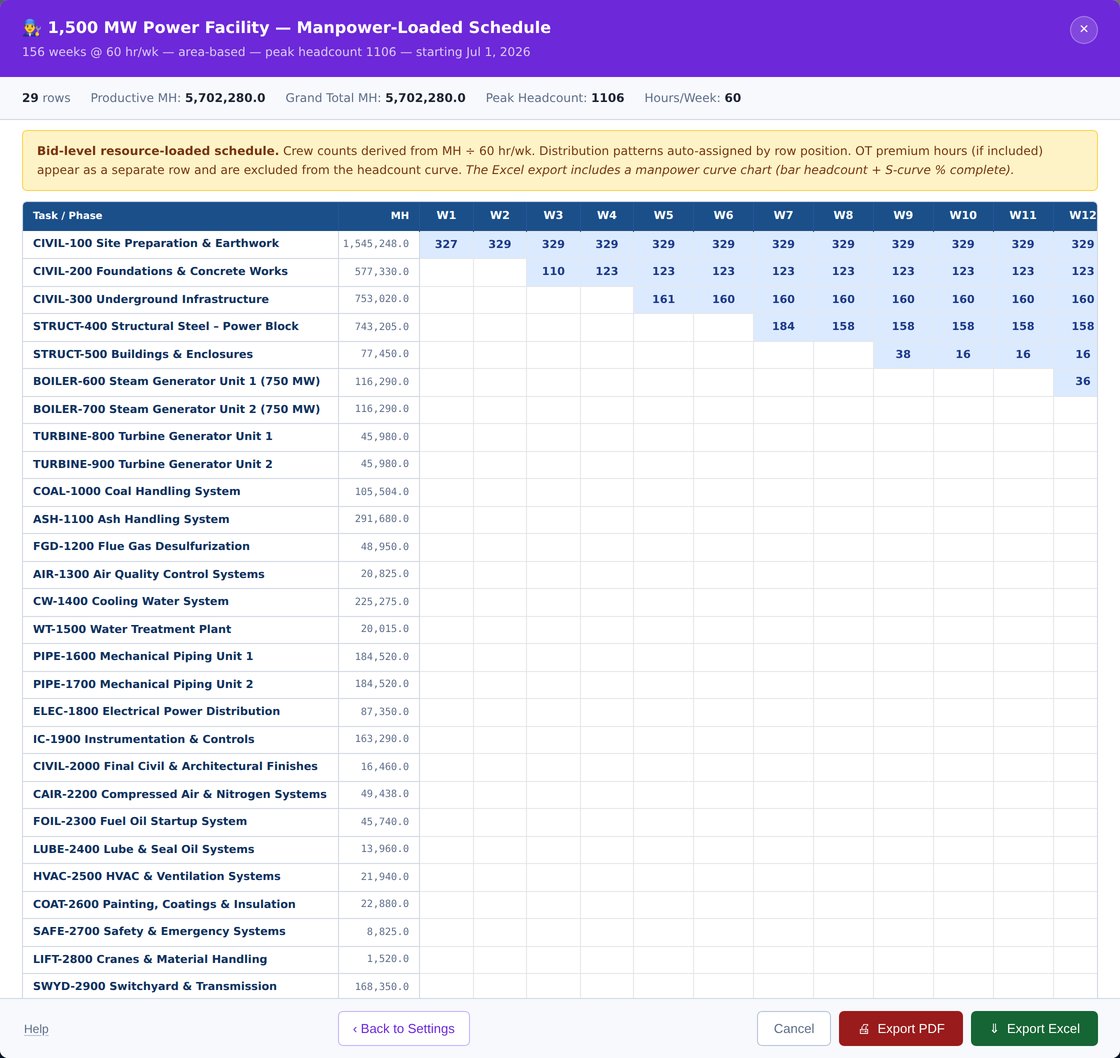
Weekly headcount by area, derived straight from the estimate's manhours — bell-curve distributions, leveled crews, and the peak headcount your site plan has to house. The Excel export adds a manpower curve chart with headcount bars and an S-curve percent-complete line.
Project Schedule (Gantt)
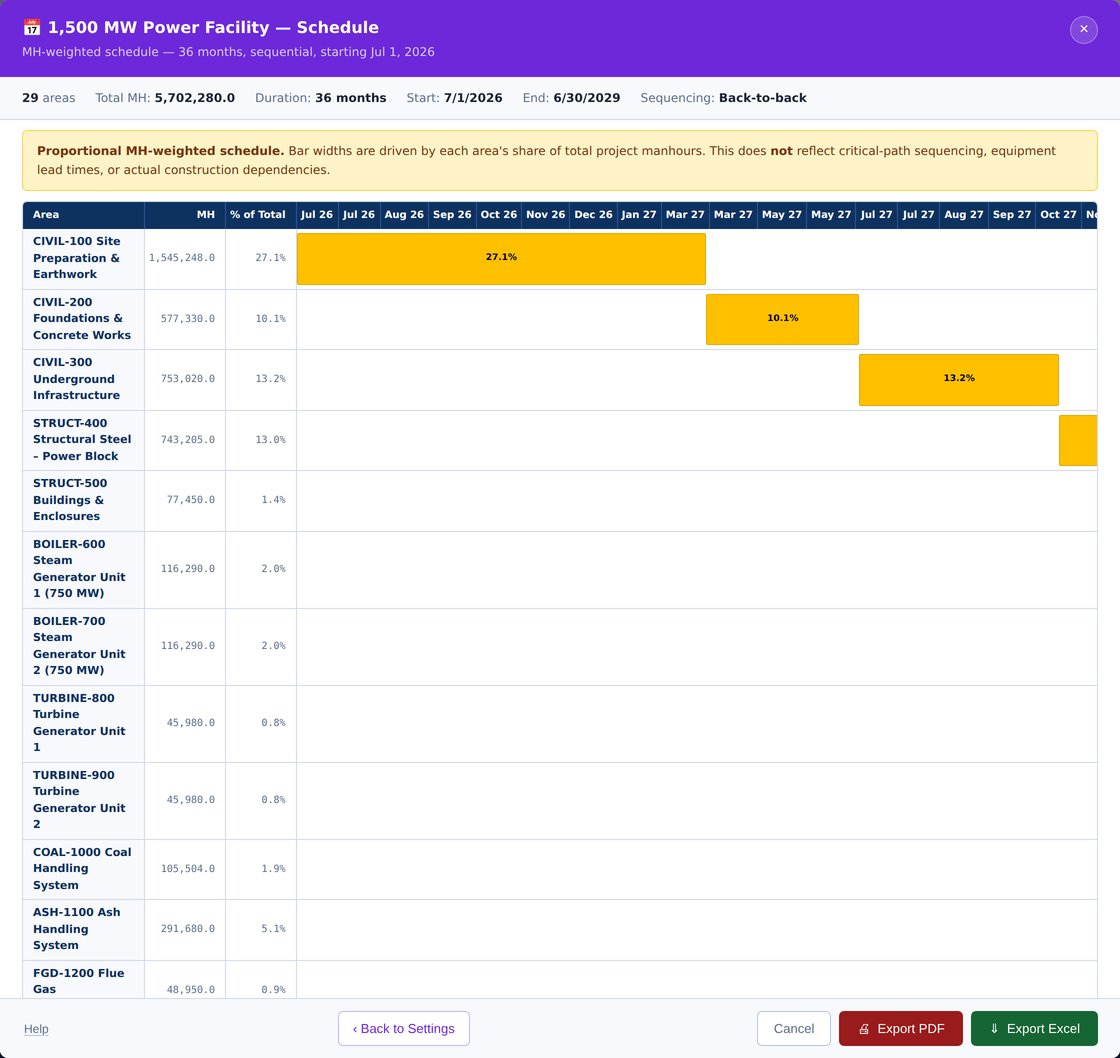
A bid-level schedule where each area's bar is sized by its share of total project manhours — the honest proportional picture for a proposal, clearly labeled as MH-weighted rather than an engineered CPM.
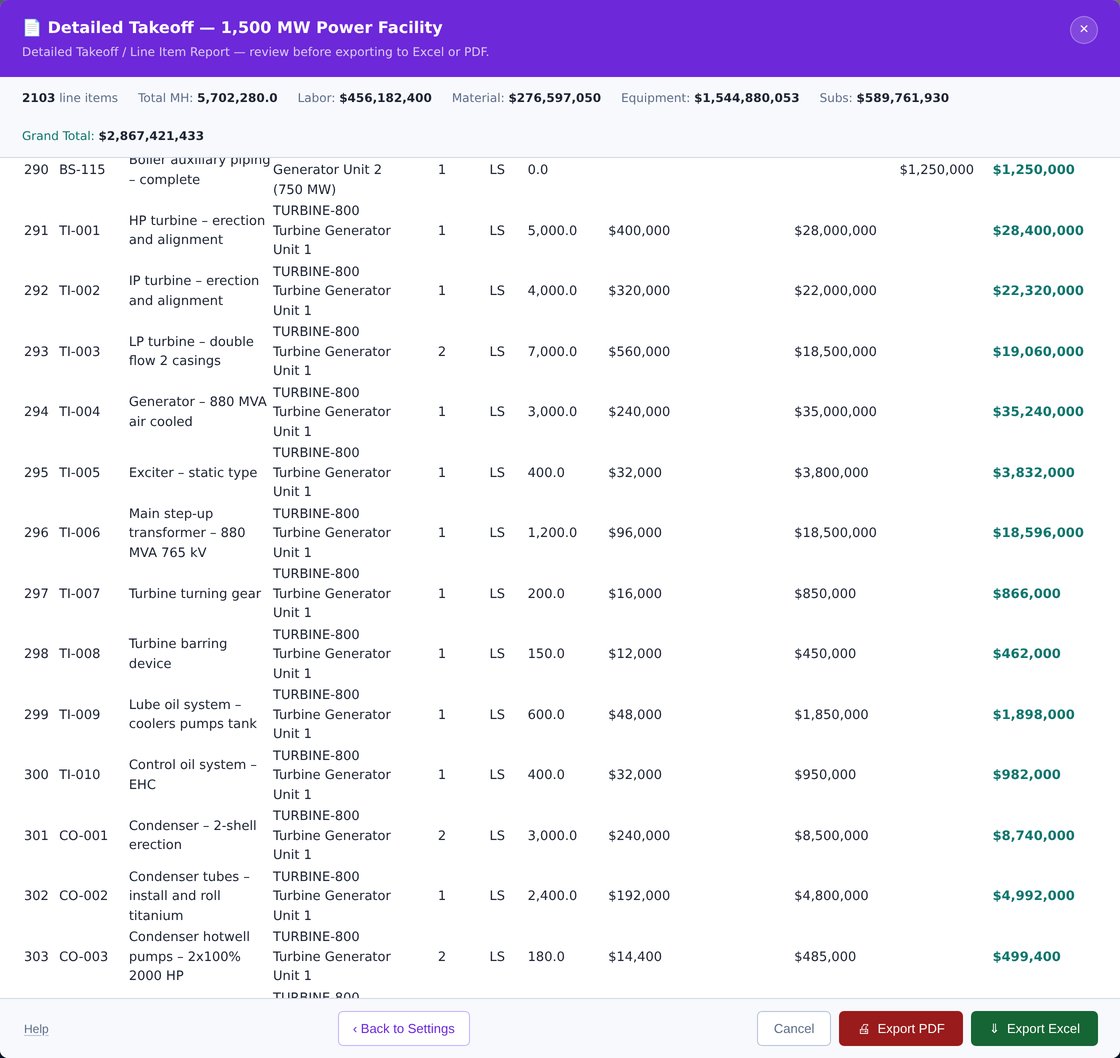
Detailed Takeoff / Line Items
Every line in the estimate, flat, with all cost primitives separated — Labor, Material, Equipment, and Subs each in their own column. Shown here scrolled to the turbine generator erection scope: HP/IP/LP turbine setting and alignment, generator rigging, condenser erection. Built for sorting, filtering, and review in Excel; the export carries live formulas, never pasted values.
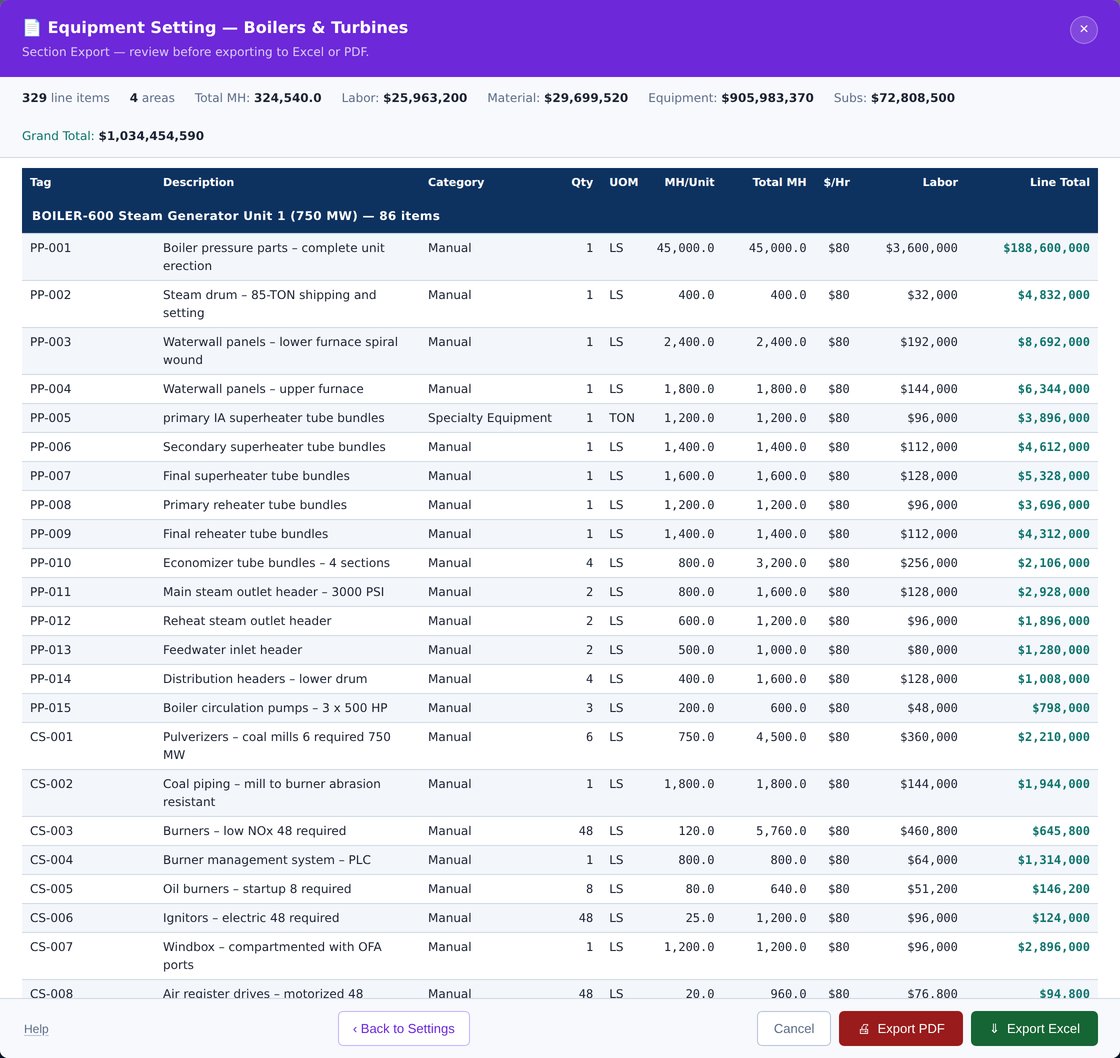
Section Export
Pick any combination of plant areas and sub-areas and produce a scoped report — for a subcontractor package, an area review, or a client breakdown — with area banding, subtotals, and your choice of column detail. Shown here scoped to the equipment setting heart of the job: both steam generator units and both turbine generators, 329 items, $1.03B.
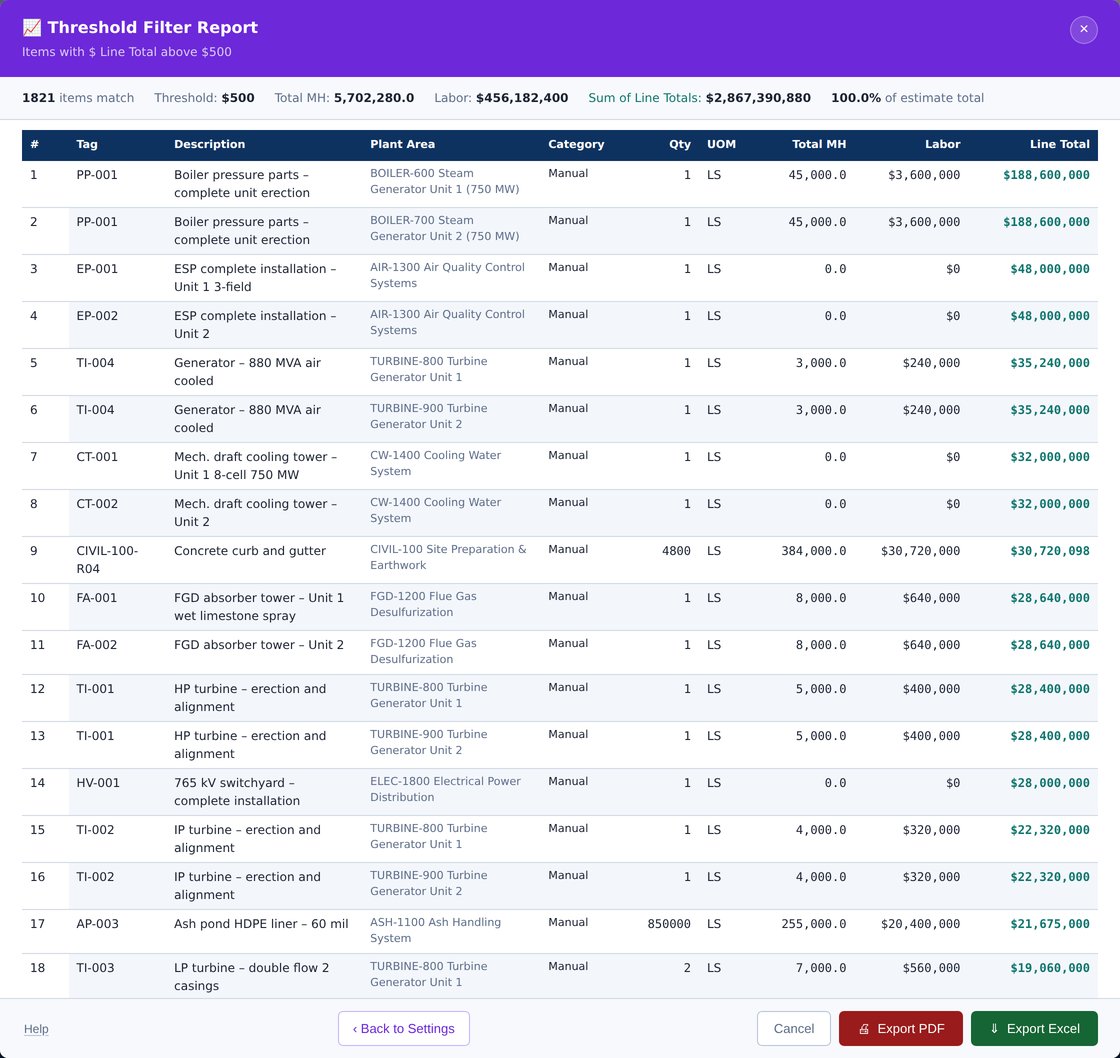
Threshold Filter
Surface every line above a dollar or manhour threshold — the fastest way to find the twenty lines that drive eighty percent of the bid, sorted and grouped how you want them for a risk review.
Need a report we don't have?
Custom reports can be built for your company for an additional fee. If your estimating group has a house format — a client-mandated breakdown, a corporate bid form, a specific Excel layout your reviewers expect — send a sample and we'll quote building it into your copy of IESE. Email [email protected].